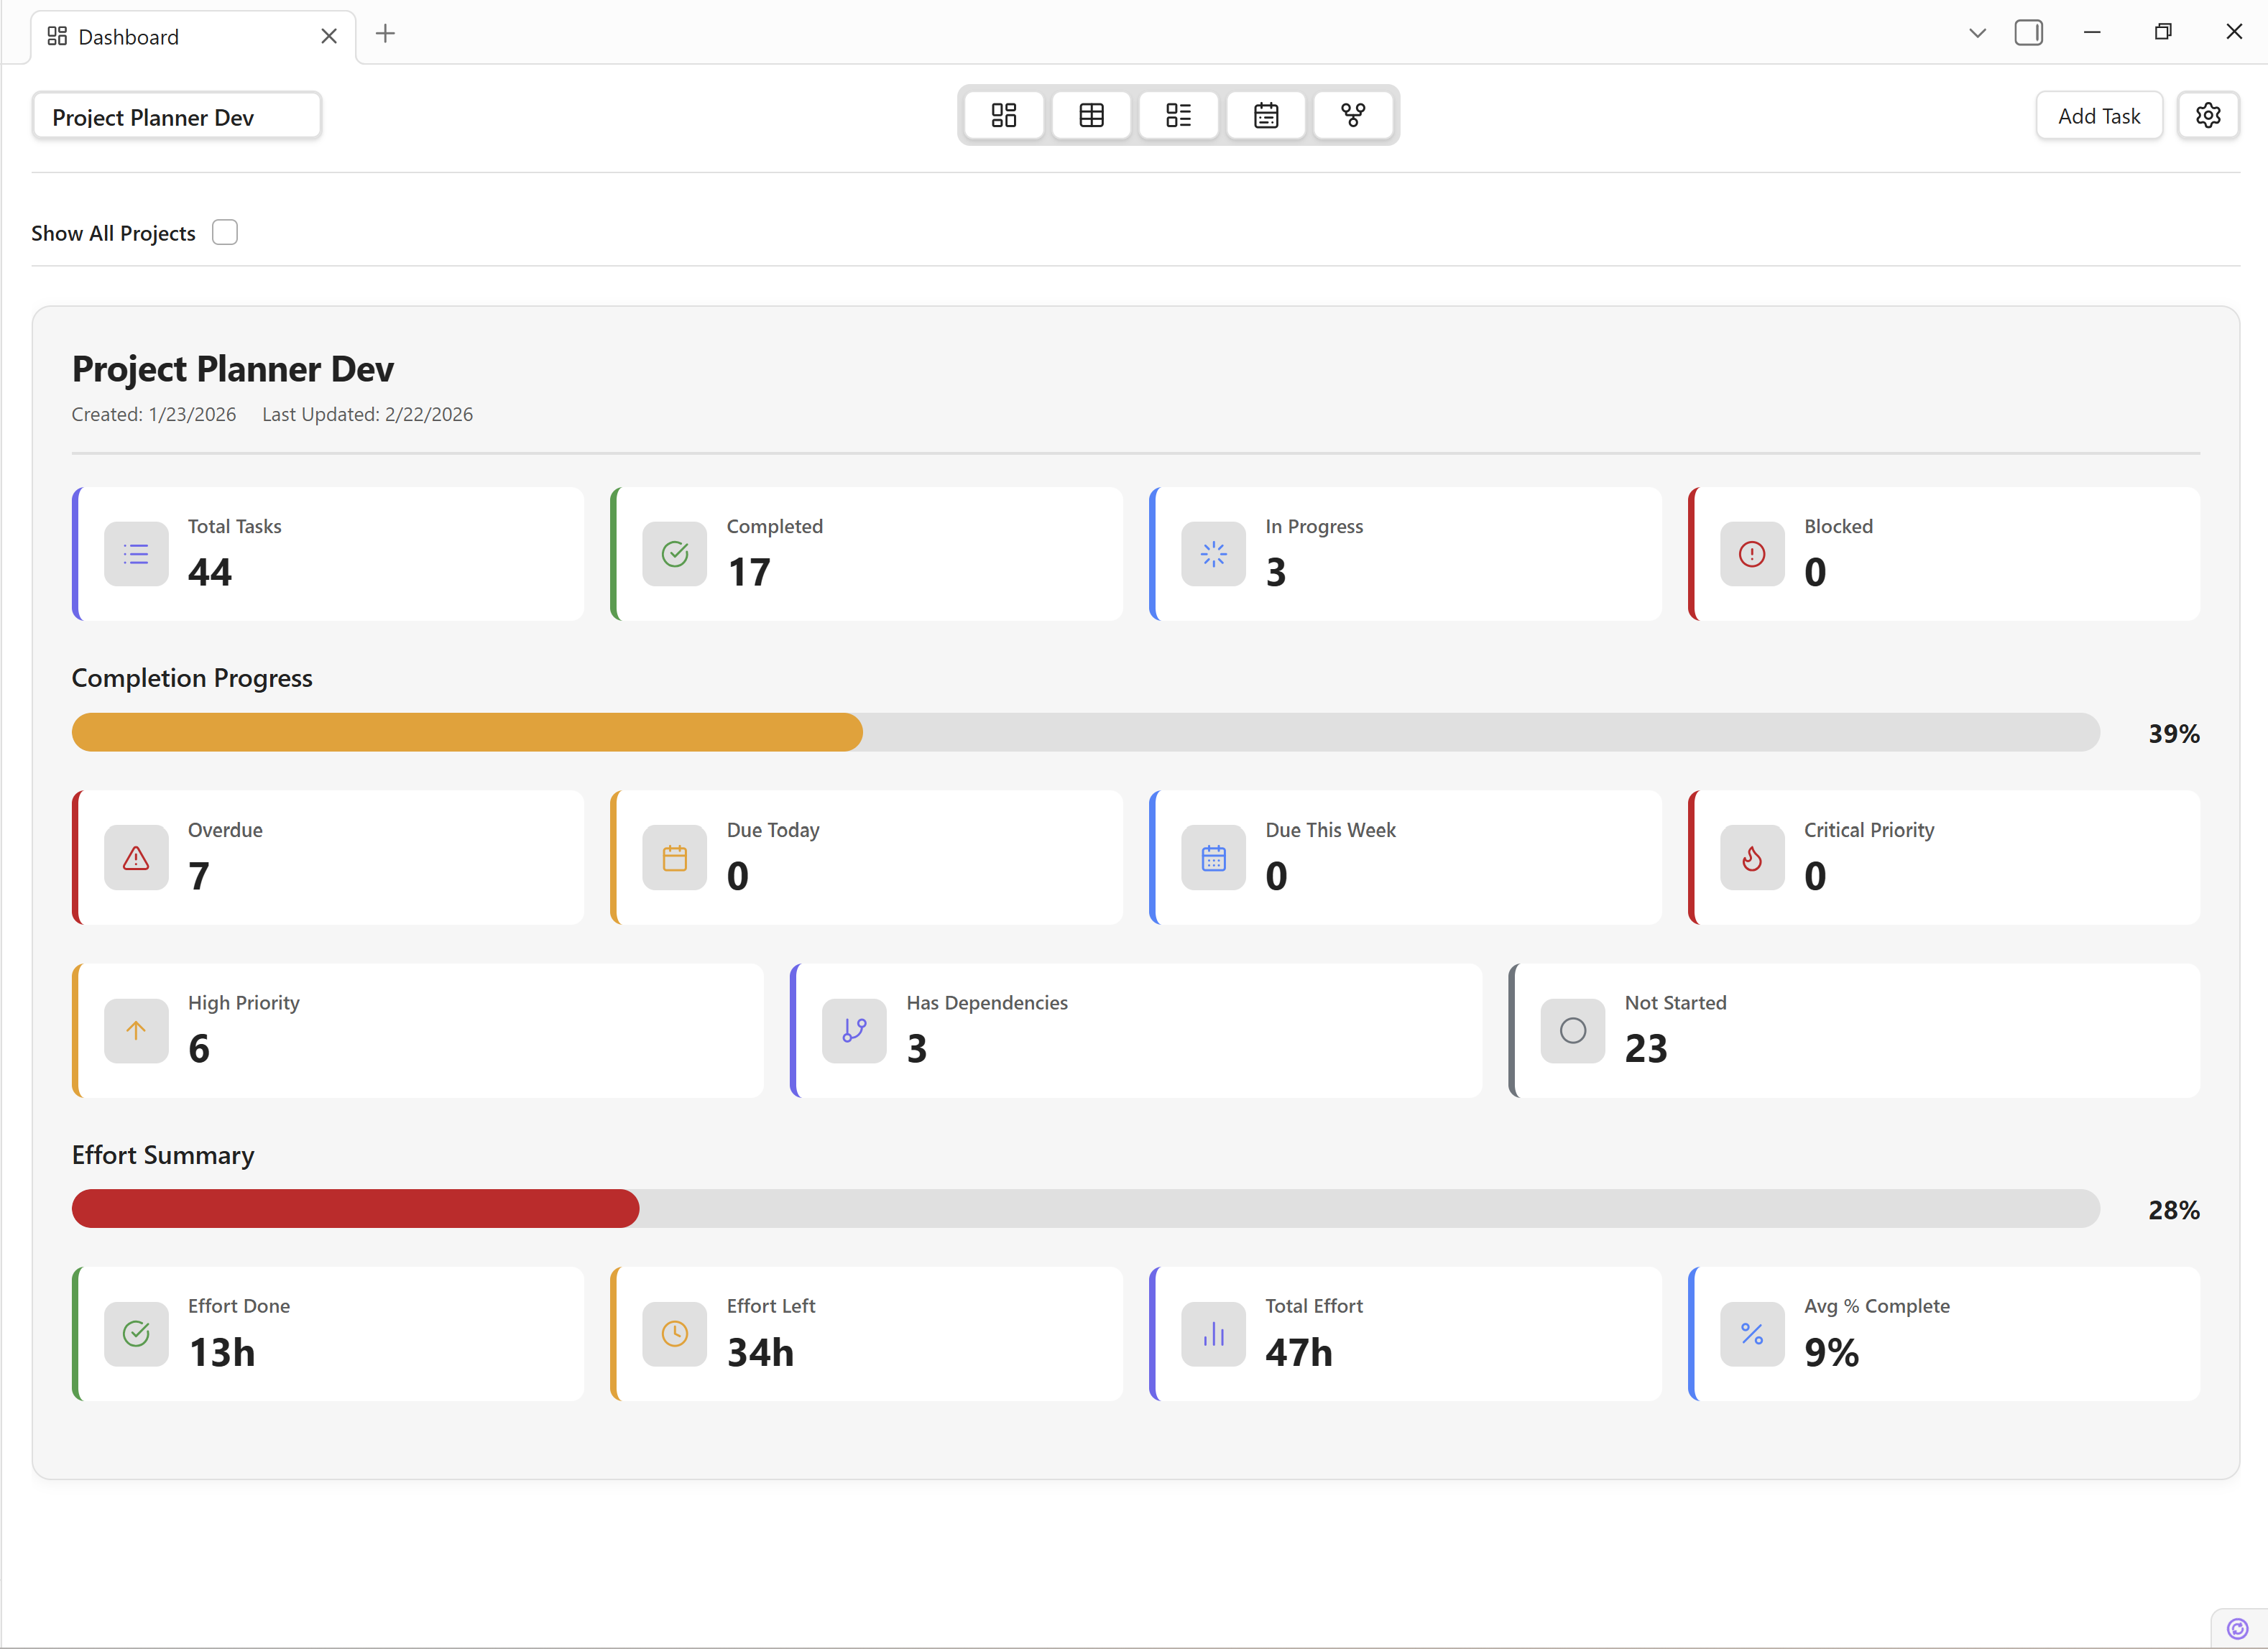
Dashboard View
The Dashboard View provides a high-level overview of all your projects and tasks. At a glance you can monitor key performance indicators, track progress across multiple projects, and jump straight into the work that matters most.
Overview
- Project Cards — visual summaries of every project in your workspace.
- KPI Metrics — real-time counters for total tasks, completed tasks, overdue items, and overall progress.
- Show All Projects — a single toggle to surface tasks from every project at once.
- Real-Time Updates — the dashboard refreshes automatically whenever task data changes.
Project Cards
Each project in your workspace is represented by a visual card. Cards display the project's status, priority, and due-date metrics so you can assess health without opening individual projects.
Card Anatomy
- Title & Icon — the project name and its assigned icon.
- Status Badge — indicates whether the project is active, on hold, or completed.
- Priority Indicator — shows the highest-priority incomplete task.
- Due-Date Summary — displays the nearest upcoming due date and any overdue count.
- Progress Bar — a visual meter of completed vs. total tasks.
Tip: Click any project card to jump directly to its task list in the Grid View.
KPI Metrics
The top of the dashboard displays key performance indicators that aggregate data across the currently visible projects:
- Total Tasks — the combined count of all tasks.
- Completed — how many tasks have been marked done.
- Overdue — tasks whose due date has passed without completion.
- Completion Rate — the percentage of tasks finished.
Note: KPI values update in real time. If you complete a task in any view, the dashboard reflects the change instantly.
View Multiple Projects
By default the dashboard scopes metrics to the currently selected project. To see tasks from every project at once, enable the "Show All Tasks" checkbox in the dashboard header bar.
- Open the Dashboard View.
- Locate the "Show All Tasks" checkbox in the header.
- Check the box — the KPI metrics and project cards will now reflect all projects.
- Uncheck to return to single-project view.
Tip: "Show All Tasks" is especially useful during stand-ups or weekly reviews when you need a cross-project summary.
Real-Time Updates
The Dashboard View listens for changes to the underlying Markdown files. Whenever a task is created, edited, completed, or deleted in any view, the dashboard automatically recalculates every metric and re-renders affected project cards — no manual refresh required.
Support & Related Pages
Need more help? Check out these related resources: