Dependency Graph View
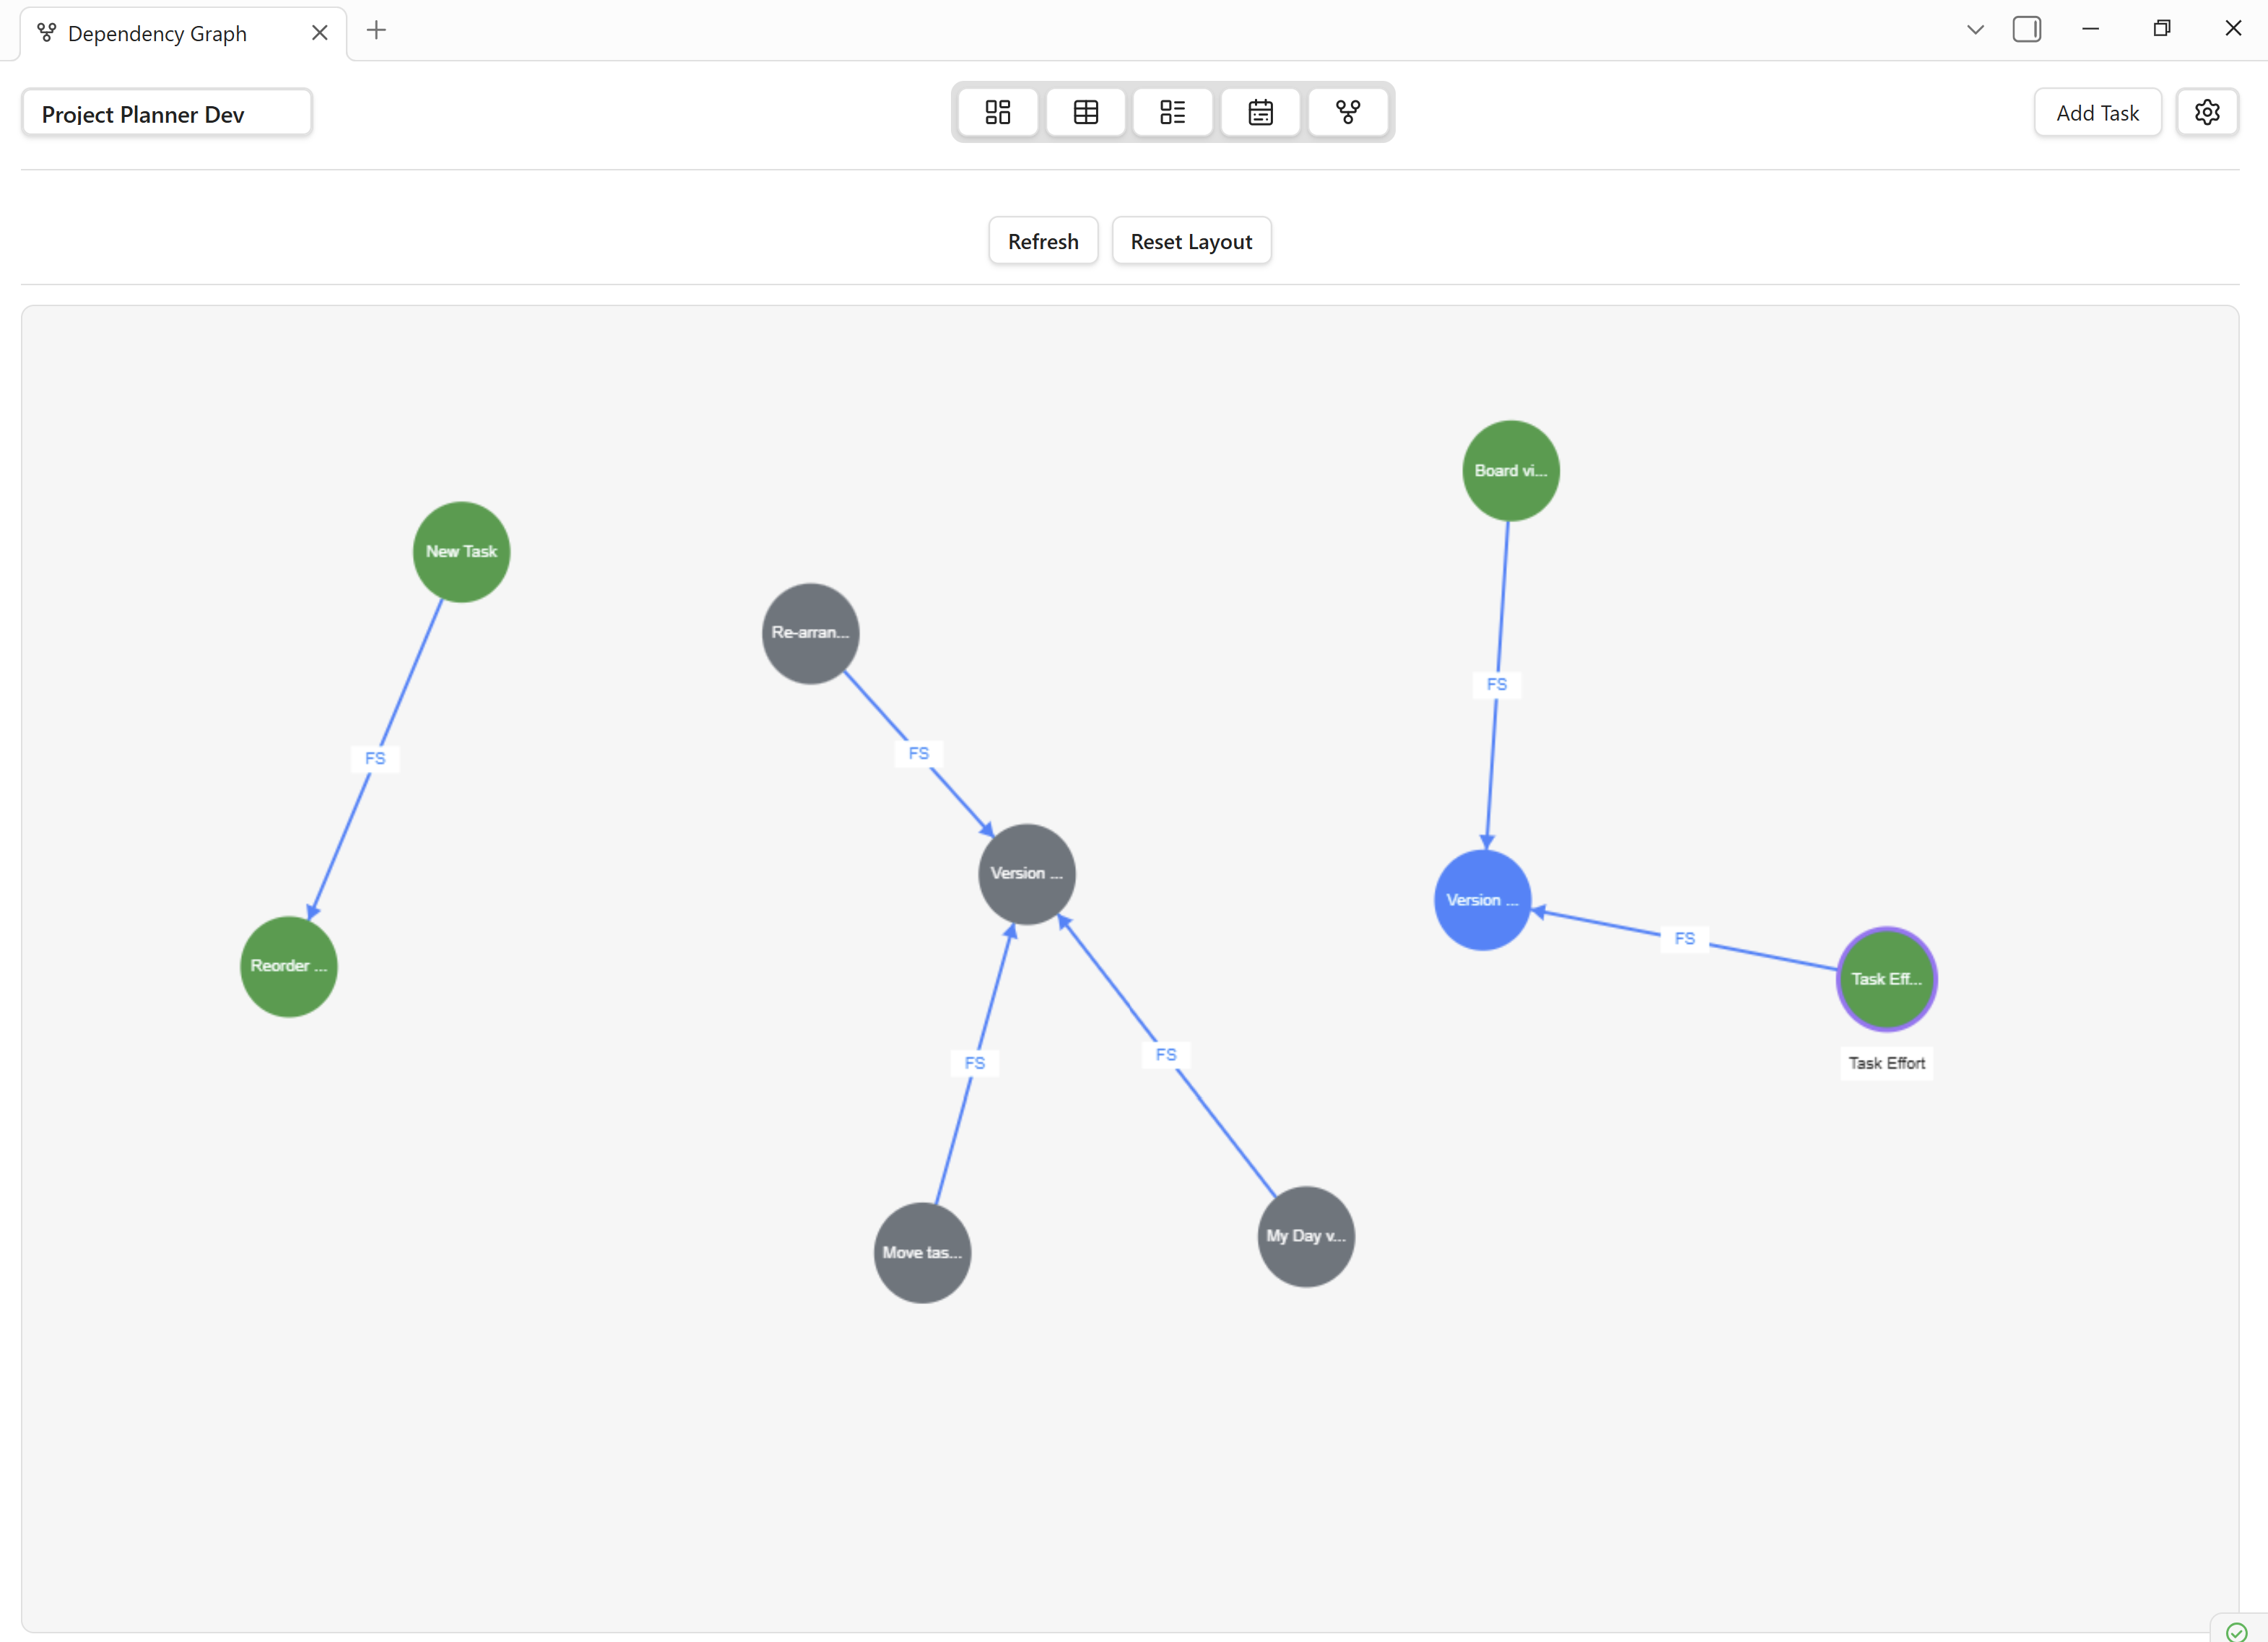
The Dependency Graph View visualizes your tasks as an interactive network of nodes and edges. It helps you understand how tasks relate to one another, identify bottlenecks, and plan work in the correct order.
Overview
- Node-Based Layout — every task is a draggable node on the canvas.
- Dependency Links — edges connect tasks that depend on one another.
- Dependency Types — supports Finish-to-Start (FS), Start-to-Start (SS), Finish-to-Finish (FF), and Start-to-Finish (SF).
- Interactive Canvas — zoom, pan, and rearrange nodes freely.
- Real-Time Sync — changes to dependencies in any view update the graph instantly.
Opening the Dependency Graph
- Click the Dependency Graph icon in the view ribbon.
- Or open the Command Palette and run "Project Planner: Open Dependency Graph".
- Or enable it in Settings → Views → Dependency Graph.
- You can also right-click a task in any other view and select "Show in Dependency Graph".
Interface
Header Bar
Contains the project selector, layout toggle, zoom controls, legend toggle, and a search field to locate specific tasks.
Graph Canvas
The main area where the dependency network is rendered:
- Nodes — represent individual tasks; size and colour encode priority and status.
- Edges — directed arrows between nodes indicating dependencies.
- Labels — task titles displayed inside or beside each node.
- Colors — configurable palette: default, overdue (red), completed (green/dimmed).
- Arrows — arrow direction shows the flow from predecessor to successor.
Legend Panel
A collapsible panel that explains the colour and shape conventions used in the graph.
Details Panel
Click a node to open a side panel showing the task's full properties and its direct predecessors/successors.
Graph Visualization
Task Nodes
- Appearance — rounded rectangles with the task title. Border colour reflects priority.
- States — normal, selected (highlighted border), hovered (tooltip), completed (dimmed).
- Indicators — small icons for overdue, has-subtasks, has-attachments, and blocked status.
Dependency Edges
- Styles — solid lines for active dependencies; dashed lines for completed predecessors.
- Types — FS, SS, FF, SF — indicated by a small label on the edge midpoint.
Layout Algorithms
- Hierarchical (default) — arranges nodes in layers from left to right based on dependency depth.
- Force-Directed — a physics-based simulation that clusters related nodes together.
- Manual — drag nodes to any position; the graph remembers your layout.
Tip: Use the hierarchical layout first to get an overview, then switch to manual mode for fine-tuning.
Task Relationships
Dependency Types
| Type | Abbreviation | Description | Example |
|---|---|---|---|
| Finish-to-Start | FS | Task B cannot start until Task A finishes. | "Design" must finish before "Development" starts. |
| Start-to-Start | SS | Task B cannot start until Task A starts. | "QA Setup" starts when "Development" starts. |
| Finish-to-Finish | FF | Task B cannot finish until Task A finishes. | "Documentation" finishes when "Development" finishes. |
| Start-to-Finish | SF | Task B cannot finish until Task A starts. | Rare — used for just-in-time scheduling. |
Managing Dependencies
- Add — drag from one node's output handle to another node's input handle, or use the Task Details Panel.
- Remove — right-click an edge and select "Remove dependency".
- Edit Type — right-click an edge and choose a different dependency type from the submenu.
Warning: Creating a circular dependency (A → B → A) is not allowed. The graph will reject the connection and display an error message.
Navigation
Zoom & Pan
- Mouse — scroll to zoom; click and drag on empty canvas to pan.
- Keyboard — + / - to zoom; arrow keys to pan.
- Toolbar — use the zoom slider and "Fit to Screen" button.
Node Interaction
- Click — select a node and open its details panel.
- Double-Click — open the full Task Details Panel.
- Hover — display a tooltip with status, priority, and dates.
Path Tracing
Select a node and press T (or click "Trace Path" in the toolbar) to highlight every predecessor and successor in the dependency chain. This is invaluable for understanding the critical path of your project.
Settings
Display Settings
- Show/hide edge labels.
- Toggle the legend panel.
- Choose colour scheme (priority-based or status-based).
- Adjust node spacing and font size.
Behavior Settings
- Default layout algorithm (hierarchical, force-directed, or manual).
- Auto-fit on open.
- Snap nodes to grid.
Integration with Other Views
- Grid View — dependency columns in the Grid link directly to this graph.
- Board View — dependency indicators on Board cards reflect the same data.
- Timeline View — dependency arrows appear on the Timeline as well.
- Task Detail Panel — the dependency manager in the details panel and the graph stay in sync.
Use Cases
Project Planning
Map out all tasks and their relationships before work begins. The graph reveals the critical path and helps set realistic deadlines.
Risk Management
Identify tasks that block many others. If a high-risk task is a predecessor to several downstream tasks, it deserves extra attention.
Team Communication
Share a screenshot or live view of the graph during stand-ups to give the team a clear picture of what's blocked and what's ready to start.
Workflow Optimization
Look for unnecessary sequential dependencies that could be run in parallel. Converting FS links to SS links where possible can shorten the overall timeline.
Best Practices
Do
- Keep dependency chains as short as possible.
- Use Finish-to-Start (FS) as the default type — it's the most intuitive.
- Review the graph regularly to catch outdated dependencies.
- Use path tracing to identify the critical path before major milestones.
- Leverage the hierarchical layout for presentations and the force-directed layout for exploration.
Don't
- Don't create dependencies between unrelated tasks just to force ordering — use task priority instead.
- Don't leave completed tasks with active outgoing dependencies — clean them up.
- Don't rely solely on the graph for scheduling — pair it with the Timeline View for date-based planning.